중국 내 건강검진 서비스 사용 결정에 있어 사회적 자본의 역할에 대한 연구
The Role of Social Capital in the Health Check-Up Service Utilization in China
Liu, Chang1; Cho, Insook1*
보건사회연구, Vol.44, No.1, pp.47-72, 2024
https://doi.org/10.15709/hswr.2024.44.1.47
알기 쉬운 요약
- 이 연구는 왜 했을까?
- 이 연구는 중국의 중장년 및 노년층을 중심으로, 사회적 자본 수준에 따라 건강검진 서비스 활용도가 어떻게 다른지를 살펴보았습니다. 중국은 인구노령화의 진행 속도가 빠르고, 도농 간 의료격차가 심해서, 저소득 노령인구에 대한 보건정책 전략을 잘 세우는 것이 중요하다. 이 연구는 저소득 노령인구에게 의료서비스를 보다 더 잘 전달하고자 할 때, 사회적 자본의 활용이 중요할 수 있음을 보이고자 한다.
- 새롭게 밝혀진 내용은?
- 이 연구에서는 가족/이웃의 지원망이 튼튼한 사람이나 사회활동 참여가 많은 사람일수록, 건강검진과 같은 예방적 의료서비스 활용도가 높다는 점을 발견하였다. 이는 사회적 자본이 개인이 의료서비스 사용을 결정하는 데 중요한 역할을 한다는 점을 보여주는 근거다.
- 앞으로 무엇을 해야 하나?
- 이 연구는 사회적 자본의 중요성을 확인하였다는 점에서 그 의의가 있다. 추가로 사회적 자본이 구체적으로 어떤 방식으로 개인의 의사결정에 영향을 미치는지에 대한 분석이 필요하다.
Abstract
Using data from the China Health and Retirement Longitudinal Study (CHARLS), this study examines the relationship between social capital and the utilization of health check-up services among middle-aged and elderly individuals in China. To address potential biases arising from interdependence within the same community, this study employs a multilevel logistic regression model. The empirical results provide strong evidence that an individual’s social capital significantly enhances the likelihood of accessing health check-up services among this demographic. The study highlights two key aspects. First, individuals with robust social networks providing financial or care support are more likely to participate in health check-up services. Second, individuals engaged in social activities are more inclined to utilize health check-up services compared to those isolated from their families or communities. This suggests that individuals with strong social capital are more likely to seek preventive healthcare services, potentially reducing the risk of hospitalization and improving their overall quality of life. In addition, this study uncovers disparities in the utilization of health check-up services between urban and rural areas. This discrepancy emphasizes the necessity for specific public health initiatives in China.
초록
본 연구는 중국의 패널 자료인 China Health and Retirement Longitudinal Study (CHARLS)를 이용하여, 사회적 자본이 중국 중·장년층의 건강검진 서비스 활용에 어떤 역할을 하는지를 살펴본다. 본 연구는 다단계 로지스틱 회귀 모형(Multilevel Logistic Regression Model)을 활용하여, 같은 지역 내 관찰값들 간 의존성으로 인한 잠재적인 편이 가능성을 제거하고자 하였다. 본 연구는 개인 수준의 사회적 자본이 중국 내 중·장년층이 건강검진 서비스를 더 많이 활용하도록 하는 긍정적인 역할을 하였다는 근거를 제시한다. 즉, 사회적 자본 수준이 높은 개인일수록 건강검진과 같 은 예방적 의료 서비스의 활용할 가능성이 높다는 것이며, 이는 중·장년층의 입원 위험을 낮추고 삶의 질을 향상시킬 수 있는 기회를 제공한다는 것을 의미한다. 또한 본 연구는 건강검진 서비스 이용에 있어서 도시와 농촌 간 격차가 존재한다는 것을 보인다. 이러한 분석 결과는 중국의 공공 보건 정책 수립에 중요한 시사점을 제공한 다.
Ⅰ. Introduction
China’s demographic landscape is undergoing a rapid transformation characterized by significant aging trends. The proportion of people aged 65 and above has witnessed a remarkable shift from 4.4% in 1980 to 14.9% in 2022 (Peng, 2023, p96). By the year 2040, it is estimated that the population of people aged over 65 will encompass 40% of the total population, which is a significant demographic transition (UN, 2023, p.23). However, the implications of this aging trend extend beyond mere numbers. The health landscape also bears the imprint of these changes. In 2019, an estimated 75% of China’s elderly population (aged 60 and above) struggled with noncommunicable diseases such as cardiovascular diseases, diabetes, or hypertension. This underscores the pressing need for comprehensive health care and wellness initiatives tailored to the specific challenges associated with an aging population. As China continues to navigate this demographic shift, it becomes increasingly crucial to foster comprehensive approaches to support the well-being and quality of life for its growing elderly population.
Considering these challenges, the potential of elderly disease detection takes on paramount significance. A large body of literature reports that the utilization of preventive care services, such as regular health check-ups, contribute to a decreased requirement for inpatient services among the elderly population and improve their self-rated health (Shinsho et al., 2001, p.314; Tian et al., 2010, p.164; Zhao et al., 2022, p.1). Regular health check-ups not only offer this opportunity but also furnish a platform for dispensing vital lifestyle guidance to patients, aiding them in the adoption of healthier habits. This insight positions health check-ups as a catalyst for patients to actively transform their unhealthy behaviors (Hackl et al., 2015, p.913). By fostering positive changes and promoting consistent well-being practices, patients can remarkably enhance and sustain their health status. This, in turn, holds the promise of accomplishing the overarching objective of curbing societal medical expenditures and alleviating the care-giving burdens faced by individuals, families, and the broader community.
In 2009, the Chinese government introduced the basic public health service program to relieve the rising burden of non-communicable diseases through public health measures and delivery of essential medical care (Qin et al., 2021, p.1). Under the elderly care package of the basic public health service, all the Chinese citizens aged 65 years or above are entitled to receive free annual health check-up services. However, owing to the delayed introduction, there is a challenge impeding its utilization at an individual level. The recognition rate of health check-ups is relatively low. According to a study using the Chinese Longitudinal Healthy Longevity Survey, only 34.72 percent of elderly individuals underwent regular health check-up services (Lee et al., 2020, p.e147). While the benefits of regular health check-up on the healthy life of elderly population is well documented, the factors that promote regular health check-ups for elderly remain largely unexplored. Therefore, this study focuses on elderly Chinese with the expectation of uncovering the main determinants of health check-up service utilization.
This study aims to investigate the role of social capital on individuals’ decisions to utilize health check-up services, using the data from the China Health and Retirement Longitudinal Study (CHARLS). To address potential biases arising from the data’s two-stage stratified clustering sampling procedure, this study employs a multilevel logistic regression model. This modeling approach is chosen to mitigate potential biases stemming from the correlation among middle-aged and elderly individuals within the same community. Moreover, this study leverage panel data to explore the causal relationship between social capital and the use of health check-up services. Notably, this study represents the first attempt to investigate the role of social capital in health check-up utilization while effectively addressing potential bias associated with community level variances and clustering.
The organization of this study is as follows: Section 2 presents a background of this research, while Section 3 provides an overview of the research methods. In Section 4, we present the empirical results and Section 5 offers discussion and concluding remarks.
Ⅱ. Background
1. Theoretical background
This study relies on Andersen's behavioral model of health service use, which provides a comprehensive framework for understanding the various factors influencing an individual’s utilization of health services. As shown in Figure 1, the Andersen model consists of three major categories: predisposing, enabling and need factors.
Figure 1.
A basic framework of Andersen model
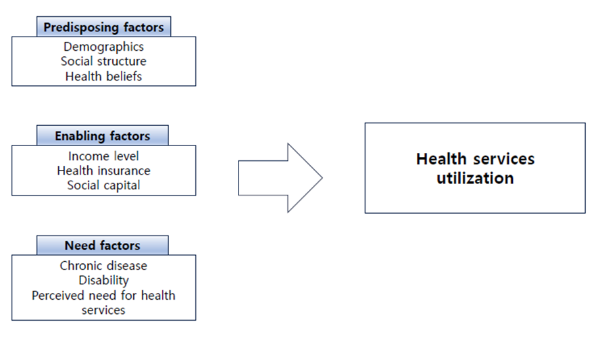
Note: This framework has been developed by the authors, referencing the model framework employed by Kim & Lee (2016).
Predisposing factors encompass individual characteristics existing before the onset of illness or healthcare need. These factors include demographic elements (age, gender, education, marital status), social structure components (family size, household composition), and health beliefs (attitudes, beliefs, knowledge about health and healthcare). Enabling factors are resources that either facilitate or hinder an individual’s access to healthcare services. This category encompasses both personal and community resources. Personal resources include income, health insurance coverage, and social support networks, while community resources involve the availability of healthcare facilities, transportation, and the presence of healthcare professionals. Need factors reflect an individual’s perceived and evaluated health needs, including perceived health status, the presence of acute or chronic health conditions, and functional limitations. The Andersen model proposes that the interaction of three categories of factors determines an individuals’ likelihood of utilizing healthcare services. Importantly, the model recognizes that healthcare utilization is a complex, non-linear process, where these factors can interact in intricate ways. For instance, an individual’s health belief (a predisposing factor) might influence their perception of health needs (a need factor), while their health insurance coverage (an enabling factor) can facilitate access to healthcare services.
Given that health check-ups fall under the domain of preventive medical services and social capital is a component of the enabling factor, this study constructs a healthcare demand function based on the Andersen model. This framework is instrumental in evaluating the factors influence health check-up utilization among the middle-aged and elderly population in China. This model framework provides a nuanced understanding of the dynamics shaping preventive care-seeking behavior in this demographic.
2. Literature Review
Regular health check-up services are integral to maintaining and enhancing individual health by identifying and addressing potential issues before symptoms manifest, enabling timely intervention and treatment. The early detection of conditions like hypertension, diabetes, and cancer during health check-ups can lead to better health outcomes and reduced healthcare costs (Ahn & Choi, 2023, p.113). These check-ups contribute to improved health outcomes by facilitating early diagnosis and treatment, especially for diseases with subtle or asymptomatic early symptoms. Assessments during health check-ups, including evaluations of risk factors like family history, lifestyle choices and personal medical history (Krogsbøll et al., 2012, p.1467), empower healthcare professionals to provide tailored advice and interventions to mitigate potential risks.
Health check-ups empower individuals to take an active role in their health by increasing awareness of their current health status and providing information about lifestyle modifications that can reduce health risks (Kang et al., 2020, p.928). Studies suggest that individuals undergoing regular health check-ups tend to have higher healthcare utilization rates, including more frequent visits to doctors and specialists (Mytton et al, 2018, p.2).
Research on the determinants of health check-ups explores factors influencing individuals’ decisions to undergo preventive health screenings and medical examinations. This understanding aids healthcare providers, policymakers and researchers in designing interventions and strategies to encourage health check-up utilization. Demographic factors, such as age, gender, socioeconomic status, education and marital status, significantly influence health check-up utilization (Casey et al., 2001, p.184, 186-187; Wu, 2003, p.676; Tian et al., 2010, p.170; Xie, 2011, p.70; Chen et al., 2014, p.1667; Zubarik et al., 2000, p.509).
Perceived health status is another crucial determinant, with individuals perceiving themselves as being in poor health or having a family history of certain illnesses more likely to seek health check-ups (Ahn & Choi, 2023, p.113). However, the connection between health status and health check-up usage remains uncertain, an individuals facing health challenges might perceive higher benefits from check-ups while those with more severe conditions might use them less frequently due to physical limitation (Wu,2003, p.677; Xie, 2011, p.69). Access to healthcare services, including health insurance coverage, is a key factor influencing health check-up use by reducing financial barriers and encouraging regular preventive care (Wu, 2003, p.677; Tian et al., 2010, p.165).
The literature indicates that higher levels of social capital correlate with an increased likelihood of engaging in preventive healthcare services, such as health check-ups, through several mechanisms. Firstly, individuals embedded in strong social networks tend to adopt healthier behaviors, including regular exercise, balanced nutrition, adherent to medical recommendation, and regular participation in health check-up services (Hong, 2023, p.183). Secondly, socially well connected individuals often enjoy enhanced access to health-related information and resources. By virtue of their connections within communities, they can exchange knowledge regarding healthcare services, available health insurance options, and preventive measures. This facilitates more informed healthcare decision making, potentially reducing the necessity for medical services (Hamano et al., 2021, p.3338; Bender et al., 2015, p.1; Shelton et al., 2016, p.1802). Thirdly, robust social networks furnish emotional and instrumental support during times of illness or medical crises (Hong, 2023, p.183). Individuals benefiting from such support systems commonly report reduced stress levels, improved mental health outcomes, and enhanced overall well-being, factors that contributes to a decreased medical demand and a higher probability of participating in preventive healthcare services, such as health check-ups.
While existing literature provide valuable insights into the link between social capital and preventive healthcare service use, it faces several limitations (Gilbert et al., 2013). Firstly the measurement of social capital is challenging due to its multifaceted nature, encompassing dimensions like trust, social networks, and civic engagement. Different studies employ varied measures, hindering cross-study and cross-population comparisons. Additionally, the generalization of empirical results from the existing studies is constrained, as research often relies on data from specific populations or regions, limiting applicability to diverse contexts with varying cultural, social and economic factors. Another limitation arises from the interconnection of social capital with confounding factors like socioeconomic status and education, necessitating careful consideration in research to avoid spurious association with preventive healthcare utilization.
Ⅲ. Methods
1. Data
This study uses data from the China Health and Retirement Longitudinal Survey (CHARLS), which constitutes a nationally representative sample of Chinese residents aged 45 and older. This dataset offers an extensive information on the socio-economic background, labor market status, household income, and their health conditions of the Chinese elderly. This data set received ethical approval from the Institutional Review Board at Peking University. The IRB approval number for the main household survey is IRB00001052-11015 (Zhao et al., 2020, p.2). This data set provides a unique opportunity to examine the relationship between social capital and healthcare service utilization among this demographic.
The CHARLS baseline survey was conducted in 2011, covering 150 regions, 450 communities, and involving 17,708 individuals from 10,257 households, reflecting the overall situation of elderly people in China (Zhao et al., 2020, p.5). Follow-up surveys took place in 2013, 2015, and 2018. For this study, we specifically utilize the last two waves of CHARLS data, as these waves contain valuable information on individuals’ social activities and their utilization of healthcare services. Especially, the 2018 wave of CHARLS data includes inquiries about respondents’ health check-ups since the previous survey, providing crucial insights into their healthcare service use. Simultaneously, the dataset captures information on respondents’ engagement in social activities, enabling the measurement of the social capital level among the middle-aged and elderly. After excluding the missing data and outliers, the final sample for the analyses consists of 9,492 middle-aged and elderly participants.
2. Variables
The dependent variable of this study is the binary variable indicating the utilization of health check-ups. CHARLS queries respondents about their history of using health check-up services since the previous survey. Using this information, we construct a binary variable for health check-up use: a value of 1 if an individual has used health check-up services since the last survey and 0 otherwise.
The primary focus of this study is on variables measuring an individual’s social capital level, assessed in four distinct aspects: (1) social support, (2) social participation, (3) reciprocity, and (4) social trust, all of which are categorical variable. Firstly, social support is gauged based on the presence of a network providing financial or care support (Yuan et al., 2022, p.520; Liu et al., 2023, p.3). This involves measuring individual economic support (received economic support from families or friends in the past year) and individual care support (having relatives or friends capable of providing long-term care in daily life). These are assigned values of 1 if affirmative responses are provided and 0 otherwise.
Secondly, social capital related to participation in various social activities is measured by assessing engagement in leisure activities, community club events, sports, social activities, community-related organization, and attendance in training courses. The variable for social participation is assigned a value of 1 if the respondent participated in any of these activities, and 0 otherwise.
Thirdly, social capital linked to reciprocity is evaluated based on participation in activities involving social reciprocity. The variable for individual reciprocity is assigned a value of 1 if the respondent provides assistance to family/friends/neighbors, participates in voluntary/charity works, or cares for sick/disabled non-cohabitant adults (Yuan et al., 2022, p.520; Liu et al. 2023, p.3).
Fourth, social trust is measured by considering the respondent’s place of residence. A value of 1 is assigned if an individual lives in their birthplace, indicating higher trust levels in the community. This is particularly true in rural areas in China, because shared birthplace and residence signifies close kinship ties among neighbors (Shen et al., 2014, p.506).
Since individuals have limited control over social capital aspects, the social capital variables are also measured at the community level. Community social capital is determined by averaging corresponding individual-level variables within the community, categorized into high and low based on the median (Yuan et al., 2022).
There are other variables that influence an individual’s decision to use healthcare services. In this study, we control a variety of determinants including demographic characteristics (gender, age, education level), labor market participation, areas of residence (urban or rural), household financial status (categorized as low, medium, or high based on household expenditure), types of health insurance, and the presence of chronic disease. Age is categorized into three groups: 45-59, 60-74, and 75 or above, reflecting the relationship between age and labor market participation. For example, the age group between 45-59 indicates that the respondent is before his/her official retirement age. Education is stratified into four tiers: illiteracy, primary school graduates, secondary education graduates, and higher education graduates. Geographic area is divided into urban and rural. Labor market status is classified into currently working and not working. Household expenditures are grouped into low, medium and high based on relative expenditure levels. The chronic disease variable is binary, indicating the presence of at least one prevalent chronic conditions including hypertension, dyslipidemia, diabetes, chronic lung diseases, chronic liver disease, coronary heart disease or other heart problem, kidney disease, digestive disease, psychiatric problem, memory-related disease, arthritis or rheumatism, and asthma. Medical insurance is crucial for healthcare serveries utilization. In this study, it is segmented into six categories: uninsured, urban employee basic medical insurance, urban resident basic medical insurance, new rural cooperative medical insurance, urban and rural resident medical insurance and government medical insurance. Table 1 illustrates the definitions of the variables for the empirical analyses.
Table 1.
Definition of variables used in this study
| Variables | Definition | |
|---|---|---|
| Dependent variable | Health check-up utilization | 0=did not use a health check-up service between 2015-2018 |
| 1=have used a health check-up service between 2015-2018 | ||
| Independent variable | Social Capital | |
| Individual economic support | 0=none | |
| 1=received any economic support from families or friends in the past year | ||
| Individual care support | 0=none | |
| 1=have relatives or friends who can provide long-term care if it is necessary | ||
| Individual social participation | 0=no participation | |
| 1=participate in social activities | ||
| Individual reciprocity | 0=none | |
| 1=participate in voluntary/charitable work | ||
| Individual social trust | 0=has moved to other region | |
| 1=currently lives in own birthplace | ||
| Community economic support | 0=low | |
| 1=the community average of individual economic support is higher than the overall average | ||
| Community care support | 0=low | |
| 1=the community average of individual care support is higher than the overall average | ||
| Community social participation | 0=low | |
| 1=the community average of social participation is higher than the overall average | ||
| Community reciprocity | 0=low | |
| 1=the community average of reciprocity is higher than the overall average | ||
| Community social trust | 0=low | |
| 1=the community average of individual social trust is higher than the overall average | ||
| Control variables | ||
| Gender | 0=male, 1=female | |
| Area | 0=urban, 1=rural | |
| Age group | ||
| Age between 45-59 | 0=age above 60 | |
| 1=age between 45-59 (before retirement age) | ||
| Age between 60-74 | 0=age below 59 or above 75 | |
| 1=age above 60-74 (after official retirement age) | ||
| Age 75 or above | 0=age below 74 | |
| 1=age above 75 | ||
| Work status | 0=do not work, 1=work | |
| Education | ||
| Illiterate | 0=other types of education | |
| 1=illiterate | ||
| Primary school graduates | 0=other types of education | |
| 1=completed primary education | ||
| Secondary education graduates | 0=other types of education | |
| 1=completed secondary education | ||
| Higher education graduates | 0=other types of education | |
| 1=completed tertiary education or above | ||
| Chronic disease | 0=none | |
| 1=have at least one chronic disease | ||
| Types of health insurance | ||
| No health insurance | 0=other types of health insurance | |
| 1=no health insurance | ||
| Urban employee basic medical insurance | 0=other types of health insurance | |
| 1=urban employee basic medical insurance | ||
| Urban resident basic medical insurance | 0=other types of health insurance | |
| 1=urban resident basic medical insurance | ||
| New rural cooperative medical insurance | 0=other types of health insurance | |
| 1=new rural cooperative medical insurance | ||
| Urban and rural resident basic medical insurance | 0=other types of health insurance | |
| 1=urban and rural resident basic medical insurance | ||
| Government medical insurance | 0=other types of health insurance | |
| 1=medical insurance for government employees |
3. Sample
This study uses the last two waves of CHARLS data, as these waves offer valuable information on individuals’ social activities and their utilization of health check-up services. Notably, the 2018 wave of CHARLS includes a crucial inquiry about respondents’ participation in health check-ups since the previous survey, providing essential data on healthcare service utilization. Simultaneously, the dataset furnishes information on respondents’ engagement in social activities, enabling the measurement of the social capital level among the middle-aged and elderly population. After excluding the missing data and outliers, the sample for the analyses retains 9,492 elderly in the final sample.
4. Empirical strategies
This study concentrates on exploring the potential influence of social capital on the utilization of health check-up services. Three primary mechanisms are proposed to elucidate how an individuals’s social capital may impact their decision to undergo health check-ups. Firstly, social capital plays a crucial role in disseminating information about the benefits of health check-ups. Positive experiences shared by family or neighbors can significantly shape an individual’s belief in public health systems and the advantages of preventive healthcare services, especially in rural areas in China. Secondly, receiving encouragement from close connections proves to be a powerful factor influencing the decision to engage in health check-ups. Previous studies highlight the positive association between recommendations from families/neighbors and higher participation rates among the elderly in rural areas. Thirdly, social capital can serve as a mediator for accessing different types of medical services, including health check-ups. Individuals with physical limitations or those residing in remote areas may find attending check-ups challenging. The involvement of family members or close neighbors in facilitating transportation to medical centers can enhance the likelihood of their participation.
The empirical model of this study relies on Andersen's behavioral model framework, specifically examining the relationship between social capital and the utilization of health check-up services. To explain the relationship between social capital and health check-up use, this study construct a healthcare demand function as below.
where is a binary variable indicating the participation in health check-up services by individual i living in community j at time t, is the social capital of individual i living community j at time t-1, is the community level social capital of community j at time t-1, is an indicator for public health insurance program eligible for individual i living in community j at time t-1, is a vector of socio-economic background of individual i living in community j at time t-1, and is a random error at time t. This demand function aims to explain how an individual’s social capital level is linked to health check-up utilization while controlling for other factors that influence healthcare service use, including predisposing, enabling, and need factors. Leveraging panel data allows the utilization of explanatory variables from the previous wave, offering insights into potential causal relationships between social capital and health check-up utilization.
To explore this relationship effectively, the study employs a multilevel logistic regression model. This model takes into account the hierarchical structure of the data and potential correlations among individuals within the same community. Operating at two levels, individual and cluster, the model assesses the odds of health check-up utilization based on predictor variables at the individual level. Simultaneously, it examines how these odds vary across communities due to social capital differences at the cluster level. This multilevel approach provides a more accurate representation of real-world data, addressing challenges related to the hierarchical structure and offering nuanced insights into how predictor variables influence outcomes across diverse contexts.
IV. Empirical Results
1. Descriptive statistics
Table 2 presents the summary statistics of the sample of this study, offering insights into the health check-up utilization and social capital of middle-aged and elderly individuals in China. Among the sample, 49.6% of the individuals utilized health check-up services between 2015 and 2018, indicating a room for improvement in the adoption rate of crucial preventive healthcare services.
Table 2.
Characteristics of Research Subjects
| Variables | N (%) | Health check-up utilization | χ2 (df) | p-value | |
|---|---|---|---|---|---|
| Yes | No | ||||
| N (%) | N (%) | ||||
| Health check-up utilization | 4,708 (49.6) | ||||
| Social capital | |||||
| Individual economic support (yes=1) | 7,731 (81.5) | ||||
| Yes | 3,895 (50.4) | 3,836 (49.6) | 10.19(1) | 0.001*** | |
| No | 813 (46.2) | 948 (53.8) | |||
| Individual care support (yes=1) | 6,440 (67.9) | ||||
| Yes | 3,284 (51.0) | 3,156 (49.0) | 15.6(1) | 0.000*** | |
| No | 1,424 (46.7) | 1,628 (53.3) | |||
| Individual social participation (yes=1) | 4,643 (48.9) | ||||
| Yes | 2,422 (52.2) | 2,221 (47.8) | 23.9(1) | 0.000*** | |
| No | 2,286 (47.1) | 2,563 (52.9) | |||
| Individual reciprocity (yes=1) | 1,798 (18.9) | ||||
| Yes | 939 (52.2) | 859 (47.8) | 6.1(1) | 0.013** | |
| No | 3,769 (49.0) | 3,925 (51.0) | |||
| Individual social trust (yes=1) | 4,706 (49.6) | ||||
| Yes | 2,252 (47.9) | 2,454 (52.1) | 11.4(1) | 0.001*** | |
| No | 2,456 (51.3) | 2,330 (48.7) | |||
| Community economic support | 4,885 (51.5) | ||||
| Yes | 2,270 (46.5) | 2,615 (53.5) | 39.5(1) | 0.000*** | |
| No | 2,438 (52.9) | 2,169 (47.1) | |||
| Community care support | 4,620 (48.7) | ||||
| Yes | 2,355 (51.0) | 2,265 (49.0) | 6.8(1) | 0.009** | |
| No | 2,353 (48.3) | 2,519 (51.7) | |||
| Comm. social participation | 4,476 (47.2) | ||||
| Yes | 2,319 (51.8) | 2,157 (48.2) | 16.6(1) | 0.000*** | |
| No | 2,389 (47.6) | 2,627 (52.4) | |||
| Community reciprocity | 4,663 (49.1) | ||||
| Yes | 2,382 (51.1) | 2,281 (48.9) | 8.1(1) | 0.005** | |
| No | 2,326 (48.2) | 2,503 (51.8) | |||
| Community social trust | 5,029 (53.0) | ||||
| Yes | 2,323 (46.2) | 2,706 (53.8) | 49.7(1) | 0.000*** | |
| No | 2,385 (53.4) | 2,078 (46.6) | |||
| Control variables | |||||
| Gender (female=1) | 4,893 (51.6) | ||||
| Male | 2,297 (50.0) | 2,302 (50.0) | 0.42(1) | 0.513 | |
| Female | 2, | 411 (49.3) | 2,482 (50.7) | ||
| Area (rural=1) | 7,172 (75.6) | ||||
| Urban | 1,371 (59.1) | 949 (40.9) | 110.7(1) | 0.000*** | |
| Rural | 3,835 (53.5) | 3,337 (46.5) | |||
| Age group | |||||
| Age between 45-59 | 4,468 (47.1) | ||||
| Age between 60-74 | 4,131 (43.5) | ||||
| Age 75 or above | 893(9.4) | ||||
| Age between 45-59 | 1,757 (39.3) | 2,711 (60.7) | 359.6(2) | 0.000*** | |
| Age between 60-74 | 2,450 (59.3) | 1,681 (40.7) | |||
| Age 75 or above | 501 (56.1) | 392 (43.9) | |||
| Work status (working=1) | 6,713 (70.7) | ||||
| Working | 3,133 (46.7) | 3,580 (53.3) | 78.7(1) | 0.000*** | |
| Not working | 1,575 (56.7) | 1,204 (43.3) | |||
| Education | |||||
| Illiterate | 2,275 (24.0) | ||||
| Primary school graduates | 3,983 (42.0) | ||||
| Secondary school graduates | 3,066 (32.3) | ||||
| Higher education graduates | 168(1.7) | ||||
| Illiterate | 1,114 (49.0) | 1,161 (51.0) | 91.1(3) | 0.000*** | |
| Graduate primary school | 1,893 (47.5) | 2,090 (52.5) | |||
| Graduate secondary school | 1,559 (50.8) | 1,507 (49.2) | |||
| Graduate higher edu. | 142 (84.5) | 26 (15.5) | |||
| Chronic disease (yes=1) | 6,930 (73.0) | ||||
| Yes | 3,623 (52.3) | 3,307 (47.7) | 73.8(1) | 0.000*** | |
| No | 1,085 (42.3) | 1,477 (57.7) | |||
| Types of health insurance | |||||
| No health insurance | 1,167 (12.3) | ||||
| Urban employee basic medical insurance | 898(9.5) | ||||
| Urban resident basic medical insurance | 367(3.9) | ||||
| New rural cooperative medical insurance | 6,857 (72.2) | ||||
| Urban & rural resident basic medical ins. | 119(1.2) | ||||
| Government medical insurance | 84(0.9) | ||||
| No health insurance | 578 (49.5) | 589 (50.5) | 203.1(5) | 0.000*** | |
| Urban employee basic medical insurance | 630 (70.2) | 268 (29.8) | |||
| Urban resident basic medical insurance | 196 (53.4) | 171 (46.6) | |||
| New rural cooperative medical insurance | 3,185 (46.4) | 3,672 (53.6) | |||
| Urban & rural resident basic medical insurance | 56 (47.1) | 63 (52.9) | |||
| Government medical insurance | 63 (75.0) | 21 (25.0) | |||
| Total number of observations | 9,492 | ||||
The primary focus of this study is social capital, measured across four dimensions. First, assessing an individual’s social networks for financial or care assistance reveals the following. In this sample, 81.5% of the respondents received economic support from families or neighbors, showcasing a robust support network. Additionally, 67.9% reported having someone for long-term care support, indicating substantial social ties within families or communities. Second, social participation was examined, with 48.9% participating in social activities. However, this suggests that a considerable portion of the sample has no social engagement and may feel somewhat isolated from the community. Third, individual reciprocity, reflecting voluntary assistance, stood at 18.9%, suggesting a lower level of mutual aid within the community. Lastly, individual social trust was reported at 49.6%, signifying a relatively high level of trust.
Community-level social capital was also considered, recognizing that social capital has both individual and collective dimensions. This binary variable indicates a high community-level social capital when the average of each individual measure within the community surpasses the overall average within the entire sample. This emphasizes the relative nature of community social capital variable.
Table 2 provides an overview of the demographic characteristics of the sample, along with the results of the chi-square tests conducted for each variable. The proportion of female is 51.6% of the sample, and 75.6% of the sample resides rural areas. Education levels were relatively low, with 24% being illiterate, 42% completing primary education. Only 32.3% and 1.7% of the sample graduated from secondary and tertiary school, respectively. Age breakdown indicates that 47.1% fall within the 45 to 59 age range, 43.5% are aged between 60 and 74, and 9.4% are 75 or older. This distribution implies that slightly over the half of the sample (52.9%) surpass the official retirement age in China, set at 60 years old. Additionally, Table 2 demonstrates that 70.7% of the respondents are currently working, suggesting a significant portion remains engaged in the labor market even after the official retirement age.
Table 2 indicates that 73% of the sample have at least one chronic symptom, emphasizing the prevalence of health issues. The types of health insurance held matter when an individual decides to use healthcare services. In this sample, 12.3% lack health insurance coverage, while most of the rural residents are enrolled in any type of basic health insurance. Table 2 shows that 72.2% of the sample are enrolled in new rural cooperative medical insurance, which suggests that almost all the rural residents have health insurance schemes which allows them to use medical services with lower level of financial burden. On the other hand, the proportion of urban residents who have health insurance scheme is lower than that of rural residents. Only 9.4%, 3.9%, and 1.25% of the sample have the urban employee basic medical insurance, urban resident basic medical insurance, and urban and rural resident basic medical insurance, respectively. Those with government medical insurance constitute less than 1% of the sample.
2. The determinants of health check-up service utilization
This section provides a comprehensive review of the determinants influencing health check-up service utilization, serving as the baseline results. Table 3 presents the estimates derived from the multilevel logistic regression model for the health demand function. The likelihood ratio chi-square value of 358.6 with 17 degrees of freedom and an associated p-value of less than 0.000 tell us that this model as a whole fits significantly better than a logistic model. Table 3 reports the ICC indicator of 12.4%, which indicates that 12.4% of the total variation in the dependent variable is attributed to differences among communities. Notably, health check-up service utilization among the middle-aged and elderly is influenced by the communities they reside, affirming the methodological advantage of employing a multilevel model for more accurate estimation.
Table 3.
The determinants of health check-up service utilization
| Predictors | Odds ratio | 95% CI |
|---|---|---|
| Age (reference = age between 45~59) | ||
| Age between 60~74 | 2.69 *** | (2.43,2.99) |
| Age older than 75 | 2.31 *** | (1.94, 2.76) |
| Gender (reference = female) | ||
| Male | 0.89 ** | (0.81,0.98) |
| Education level (reference = illiterate) | ||
| Primary school graduates | 1.00 | (0.89,1.13) |
| Secondary school graduates | 1.33 *** | (1.15,1.53) |
| Higher education graduates | 5.16 *** | (3.19,8.35) |
| Employment status (reference = retired) | ||
| Currently working | 1.02 | (0.91,1.14) |
| Household expenditure level (reference =low) | ||
| Middle group | 1.08 | (0.97,1.20) |
| Highest group | 1.23 *** | (1.26,1.55) |
| Chronic disease (reference = none) | ||
| Has at least one chronic disease | ||
| Area of living (reference = rural) | ||
| Urban | 1.23 *** | (1.06, 1.43) |
| Type of health insurance (reference = no medical insurance) | ||
| Urban employee basic medical insurance | 1.83 *** | (1.47,2.28) |
| Urban resident basic medical insurance | 1.00 | (0.76,1.32) |
| New rural cooperative medical insurance | 1.05 | (0.91,1.21) |
| Urban and rural resident basic medical insurance | 0.77 | (0.50,1.19) |
| Government medical insurance | 1.99 ** | (1.14,3.48) |
| Hosmer-Lemeshow Chi-squared† | 28.21 | |
| p-value (Prob>Chi-squared) | 0.0004 | |
| LR Chi-squared | 358.6 | |
| p-value (Prob>Chi-squared) | 0.000 | |
| ICC | 0.124 | |
| Pseudo R-squared | 0.0548 | |
The multilevel logistic model offers a distinct advantage in terms of its straightforward and practical interpretation. Estimates from the model provide a meaningful understanding of the odds, or conditional probability, of an event occurring while accounting for data dependencies. Table 3 illustrates that the likelihood of utilizing health check-up services increases with age. Elderly individuals in the age group of 60-74 or above 75 are 2.7 and 2.3 times more likely to undergo health check-ups compared to the reference group, those aged 45-59. This suggests a heightened interest in health and increased participation in health check-up services as individuals age. However, considering the national provision of free annual health check-ups for individuals above 65, it also implies that out-of-pocket expenses might play a pivotal role in health service utilization decisions. The estimate for the working variable indicates that labor market participation status does not significantly impact health check-up service utilization. Coupled with the age variable results, this suggests that having more time post-retirement might not be a crucial factor in deciding to use health check-up services. Instead, eligibility for free medical check-ups after the age of 65 appears to be a more influential factor in the decision making process.
Further more, Table 3 reveals that males are less likely to undergo health check-ups compared to females, with the probability for males being 0.83 times that of their female counterparts. Educational level significantly influences health check-up utilization, with individuals who completed secondary education being 1.3 times more likely to use health check-up services compared to the illiterates. Those with college education or above are 5.2 times more likely to undergo health check-ups than the illiterate. This emphasizes the role of education in choosing preventive healthcare services, potentially driven by increased awareness of the benefits or a lower discount rate for time among the highly educated.
Household expenditure variables indicate that income level is a crucial determinant, with individuals in the top 1/3 income group being 1.2 times more likely to use health check-up services than those in the bottom 1/3 income group. Individuals in better financial situations tend to opt for health check-up services more frequently. Individuals with chronic diseases are 1.4 times more likely to use health check-ups, as it aligns with the natural inclination of those with ongoing health concerns to monitor their health status.
Urban residents exhibit a 1.2 times higher likelihood of using health check-up services than rural residents. This discrepancy may be attributed to the convenience of urban transportation and the availability of numerous health check-up facilities in urban ares. Moreover, the types of health insurance scheme is correlated with health check-up service use. Those with urban employee medical insurance and government medical insurance are 1.83 times and 1.99 times more likely to undergo health check-ups, compared to those with no health insurance coverage. This may be due to the enhanced welfare benefits, including free health check-ups, provided through these insurance schemes.
3. Individual-level of social capital and health check-up service utilization
Table 4 presents the estimation results of the health service demand model, incorporating individual-level social capital variables. While all control variables from Table 3 are included in the model, their estimates are not reported in Table 4 for the sake of convenience. The likelihood ratio chi-square statistic of 362.52 with 20 degrees of freedom and an associated p-value of less than 0.000 indicate that the model as a whole fits significantly better than a logistic model. Table 4 shows the model’s ICC indicator of 12.6%, which reveals that 12.6% of the total variation in health check-up use is attributed to differences among communities. This underscores the influence of communities on the health check-up patterns of the sample, supporting the use of a multilevel model for more accurate estimation.
Table 4.
The relationship between social capital and health check-up service utilization
| Predictors | Model (1) | |
|---|---|---|
| Odds ratio | 95% CI | |
| Social capital | ||
| Individual economic support (reference = no) | ||
| Yes | 1.18 *** | (1.04,1.33) |
| Individual care (reference = no) | ||
| Yes | 1.20 *** | (1.09,1.33) |
| Individual social participation (reference = no) | ||
| Yes | 1.14 *** | (1.04,1.26) |
| Individual reciprocity (reference = no) | ||
| Yes | 1.15 ** | (1.02,1.30) |
| Individual social trust (reference = no) | ||
| Yes | 1.05 | (0.94,1.17) |
| Hosmer-Lemeshow Chi-squared† | 24.99 | |
| p-value (Prob>Chi-squared) | 0.0016 | |
| LR Chi-squared | 362.52 | |
| p-value (Prob>Chi-squared) | 0.0000 | |
| ICC | 0.126 | |
| Pseudo R-squared | 0.0562 | |
| Number of observations | 9492 | |
Results from Table 4 indicate a positive association between individual-level social capital and health check-up service utilization. Firstly, the individual economic support variable is positively correlated with the likelihood of using health check-up services. Individuals with social networks providing economic support are 1.18 times more likely to utilize health check-up services compared to those without such support. This estimate is statistically significant at the 1 percent level. Similarly, the individual care support variable exhibits a positive correlation, with individuals having networks for potential unpaid long-term support being 1.2 times more likely to use health check-up services compared to those without such support. This estimate is statistically significant at the 1 percent level. This result further emphasizes that individuals with social capital offering tangible assistance are more inclined to engage in health check-up services.
Secondly, the individual social participation variable is positively correlated with the probability of utilizing health check-up services. Those participating in various social activities are 1.14 times more likely to use health check-up services compared to those who do not participate in any of social activities. The estimate is statistically significant at the 1 percent level. As for the individual reciprocity variable, the coefficient is 1.15, and the estimate is statistically significant at the 5 percent level. In essence, those who actively participate in social activities, including voluntary endeavors, are more likely to access health check-up services. This underscores the role of social capital in disseminating positive health-related information within the community.
In contrast to other social capital variables, the social trust variable does not exhibit a significant relationship with the health check-up service utilization. The estimate for the individual social trust variable is not statistically significant at any conventional level of significance. Overall, the results indicate a significant increase in the probability of health check-up utilization among middle-aged and elderly individuals with a higher level of social capital. Social capital influences health service decisions when it plays a role in disseminating positive information, encouraging participation in health services, and providing actual support for accessing medical services.
Table 5 presents the results of multilevel logistic estimation results for models incorporating community-level social capital variables. Model (2) reports estimates with only community-level social capital variables, and Model (3) includes both individual and community-level social capital variables. While all control variables from Table 3 are included in these models, their estimates are not reported in Table 5 for convenience reasons. The likelihood ratio chi-square statistic for Model (2) and Model (3) are 344.34 (with 22 degrees of freedom) and 347.7 (with 27 degrees of freedom), respectively. Associated p-values are less than 0.000 for both. These indicate that both models significantly outperform a logistic model. Table 5 also reports that the ICC indicators for Model (2) and Model (3) as 12.1% and 12.2%, respectively. These indicate that 12.1% and 12.4% of the total variation in dependent variable is attributed to differences among communities.
Table 5.
The community level social capital and health service use
| Model (2) | Model (3) | |||
|---|---|---|---|---|
| Predictors | Odds ratio | 95% CI | Odds ratio | 95% CI |
| Social capital | ||||
| Individual economic support (reference = no) | ||||
| Yes | 1.21 *** | (1.07,1.37) | ||
| Individual care (reference = no) | ||||
| Yes | 1.20 *** | (1.09,1.32) | ||
| Individual social participation (reference = no) | ||||
| Yes | 1.14 *** | (1.03,1.25) | ||
| Individual reciprocity (reference = no) | ||||
| Yes | 1.14 ** | (1.01,1.29) | ||
| Individual social trust (reference = no) | ||||
| Yes | 1.06 | (0.95,1.18) | ||
| Community economic support (reference = low) | ||||
| High | 0.79 *** | (0.67,0.94) | 0.77 *** | (0.65,0.91) |
| Community care (reference = low) | ||||
| High | 1.13 | (0.96,1.33) | 1.09 | (0.93,1.28) |
| Community social participation (reference = low) | ||||
| High | 1.04 | (0.87,1.23) | 1.02 | (0.85,1.21) |
| Community reciprocity (reference = low) | ||||
| High | 1.08 | (0.91,1.28) | 1.05 | (0.89,1.25) |
| Community social trust (reference = low) | ||||
| High | 0.91 | (0.77,1.08) | 0.90 | (0.76,1.07) |
| Hosmer-Lemeshow Chi-squared† | 24.31 | 23.91 | ||
| p-value (Prob>Chi-squared) | 0.0020 | 0.0024 | ||
| LR Chi-squared | 344.34 | 347.7 | ||
| p-value (Prob>Chi-squared) | 0.000 | 0.000 | ||
| ICC | 0.121 | 0.122 | ||
| Pseudo R-squared | 0.0569 | 0.0599 | ||
| Number of observations | 9492 | 9492 | ||
In the first column, the results reveal that most community-level social capital variables do not have a significant relationship with the use of health check-up services, except for the community-level economic support variable. The estimate for the community-level support variable is 0.79, suggesting that individuals living in a community with a higher level of economic support are less likely to use health check-up services compared to individuals in a community with a lower level of economic support. Interpreting this, a higher level of community economic support implies that community members are more likely to receive financial support from their families or neighbors compared to the average member of the entire sample. This may imply that individuals in relatively poorer communities are less likely to utilize preventive health care services compared to those in financially better-off communities.
The last column presents the complete model incorporating both individual and community levels of social capital. Similar to the results in Model (2), the coefficients for community-level social capital are not statistically significant at any conventional level of significance, except for the community economic support variable. This implies that middle-aged and elderly individuals in relatively poor communities are less likely to use health check-up services unless they have social networks to provide financial or care support. Regarding individual-level social capital, the overall results align with Model (1). Four out of five measures for social capital are positively correlated with one’s decision to use health check-up services. The coefficients for individual-level economic support, care support, social participation and reciprocity variables have values greater than 1, suggesting a higher probability of using health check-up services. Moreover, these coefficients are statistically significant at the 5 percent level. The only exception is the individual-level social trust variable, which is not statistically significant at any conventional level of significance.
In summary, the estimation results in Tables 4 and 5 underscore the significant role of social capital in the utilization of health check-up services. This study assesses three models of social capital: Model (1) evaluates the correlation between individual-level social capital and health check-up service use, Model (2) assesses the correlation between community-level social capital and the utilization of health check-up services, and Model (3) represents a comprehensive model incorporating both individual and community-level social capital variables.
Models (2) and (3) indicate that, on the whole, community-level social capital does not exert a significant effect on an individual’s decision to utilize health check-up services. However, a crucial exception emerges, proving valuable insights into health check-up promotion strategies. The estimate for the community economic support variable is statistically significant, and its value below 1.0 implies that individuals residing in communities where members receive economic support more than the average are less likely to use health check-ups. This suggests that in economically disadvantaged communities, particularly those lacking social networks for economic support, financial assistance is essential to enhance the utilization of preventive health care services.
On the contrary, individual-level social capital emerges as a critical determinants of health check-up service utilization. Two major findings stand out. Firstly, social capital measures indicating individuals with economic or care support exhibit a positive relationship with health check-up use. This implies that individuals with close-knit social networks, comprising family or neighbors who can provide tangible assistance, are more likely to encourage elderly family members to avail themselves of preventive health care services. Secondly, social capital measures related to social activity participation reveal that individuals engaged in social activities or voluntary work are more likely to undergo health check-ups. The estimates for both variables are greater than 1.0, indicating that those participating in social activities or voluntary endeavors are more likely to utilize health check-up services. This underscores the role of social capital within communities, families, or workplaces in providing opportunities for elderly members to access vital information on the benefits of health check-ups, emphasizing the pivotal role of social networks in disseminating crucial health-related information.
V. Discussion and Conclusion
Using 2015 and 2018 CHARLS data, this study explores the relationship between social capital and the uptake of health check-up services among middle-aged and elderly in China. The study identifies two pivotal mechanisms through which social capital influences preventive healthcare service demand: the presence of supportive social networks and active engagement in social activities. Firstly, this study reveals that individuals with stronger social networks, providing financial or care support, are more likely to undergo health check-ups. This implies encouragement from close friends or families could have a major impact on one’s decision to use preventive healthcare services such as health check-ups. Secondly, the study shows that active participation in various social activities is correlated with a higher health check-up utilization. This emphasizes the influential role of social relationship in disseminating crucial information regarding the advantages of preventive healthcare services, positively shaping health intentions and behaviors.
However, empirical findings suggest that community-level social capital may not significantly influence individual’s decisions to utilize preventive healthcare services. While social capital within communities is vital for nurturing trust and cooperation among members, China encounters substantial challenges concerning social capital due to rapid urbanization, widening economic disparities, and swift cultural transformations. The influx of rural-to-urban migration disrupts traditional community structures, leading to a weakening of established ties and networks. Moreover, the country’s pronounced economic disparities, coupled with rapid economic growth, have eroded social cohesion and solidarity within communities, posing obstacles to the establishment and sustenance of social capital. Furthermore, China’s swift modernization and urbanization have spurred cultural shifts away from traditional communal values towards more individualistic attitudes, thereby diminishing the significance of community ties and weakening social capital. Consequently, community-level social capital appears to have limited impact on individual’s healthcare-related decision in China. Nonetheless, individual-level social capital continues to exert a positive influence, particularly among middle-aged and elderly Chinese.
According to the data drawing from the CHARLS, less than half of Chinese elderly individuals has undergone health check-ups in the past three years. Examining the relationship between social capital and health check-up utilization among Chinese older adults, this research highlights the significance of preventive healthcare for individual and societal well-being. The study pinpoints social networks and community participation as key influencers in health-related decision making.
Leveraging the social capital of older adults can effectively promote health check-up awareness and adoption. Recommendations from close individuals significantly influence participation, suggesting community-based health promotion strategies as effective approaches. To enhance public health, the Chinese government should encourage social participation among older adults through increased social activities and mass media promotion. Financial support for elderly social organizations, coupled with policies promoting frequent social activities, can enrich the daily lives of older adults and improve their health outcomes.
Disparities in preventive healthcare service utilization rate by income, region, and other socio-economic background underscores the need for targeted interventions. Further exploration of non-participation causes is crucial for developing strategies to reduce the disparities in the utilization of preventive healthcare services including health check-ups. In addition, further studies are required to evaluate the importance of aftercare programs and infrastructure development to complement free health check-up services.
In summary, this study contributes evidence to improve public health strategies in China emphasizing the importance of social participation in promoting health check-up utilization among older adults. The findings call for targeted interventions and community based initiatives to address disparities and enhance the overall health and well-being of the aging population.